
Best Time to Visit Aruba: Month-by-Month Guide (2027)
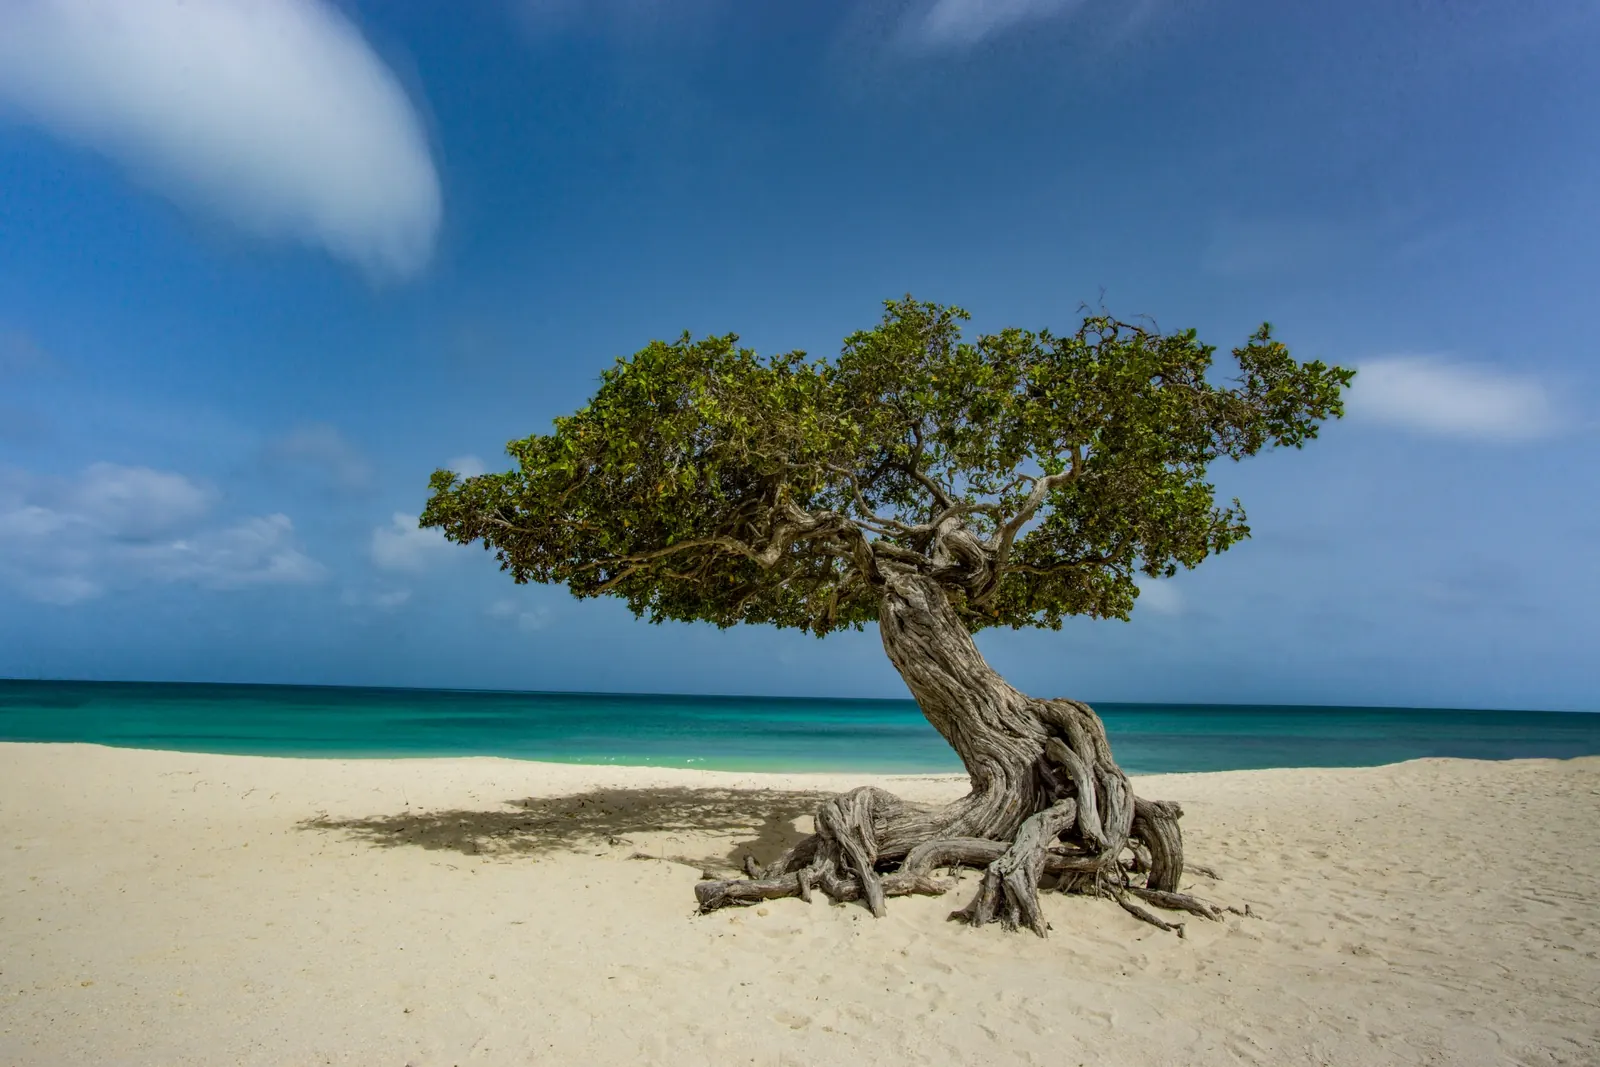
On Aruba, the wind can change a beach day more than the temperature. June’s easterly trade winds average 8.8 m/s (31.7 km/h), compared with 5.6 m/s (20.2 km/h) in November. Yet average daytime highs remain above 30°C throughout the year. The difference matters: a month that appeals to windsurfers may be less suitable for travelers seeking lighter breezes.
The best time to visit Aruba is March through May for exceptionally low rainfall. April is the driest month, averaging 8.6 mm of rain, while May is also very dry at 14.1 mm. Late April and May are especially worth considering for favorable weather after the main winter tourism season.
Windsurfers and kitesurfers may prefer May through July, when average winds are strongest. September through November is less windy but can be hotter or wetter. Actual hotel prices vary, so compare complete quotes for your dates instead of assuming a particular month guarantees savings.
This guide uses the Meteorological Department of Aruba’s official 1991–2020 climate normals to examine monthly temperatures, rainfall, rainy days and wind conditions.
When is the best time to visit Aruba?
March through May is the most appealing period for visitors prioritizing low rainfall. April is the driest month, followed by March and May. Late April and May also fall after much of the main winter high season, although accommodation discounts are property- and date-specific.
| Priority | Best months | Trade-off |
|---|---|---|
| Best overall dry-weather period | March–May | Spring holidays and strengthening winds |
| Lowest average rainfall | March–May | April is driest at 8.6 mm |
| Windsurfing and kitesurfing | May–July | Strong winds and changing marine conditions |
| Lighter average breezes | September–November | Higher heat or increasing rainfall |
| Low-season accommodation offers | September–November | Compare room prices and cancellation terms |
| Dry weather outside winter peak | Late April–May | Holiday-demand exceptions |
| Carnival | January–early February | Parade crowds and hotel demand |
| Hiking and sightseeing | January–March | Strong midday heat remains |
In 2027, Easter Sunday falls on March 28. Early-April school holidays may still keep some accommodation prices elevated, so compare late April and May rather than expecting prices to fall automatically on April 1.
The Aruba Tourism Authority identifies December–April as peak season and September–November as off-season. These broad patterns are not a guarantee of specific hotel prices.
Aruba weather by month: official climate data
Average daytime highs stay above 30°C throughout the year, from 30.3°C (86.5°F) in January to 33.2°C (91.8°F) in August and September. The largest seasonal differences for many travelers are rainfall and wind speed.
| Month | Average high | Average low | Rainfall | Rainy days | Mean wind |
|---|---|---|---|---|---|
| January | 30.3°C / 86.5°F | 24.8°C / 76.6°F | 44.0 mm | 10.8 | 7.2 m/s |
| February | 30.6°C / 87.1°F | 24.8°C / 76.6°F | 19.5 mm | 4.5 | 7.7 m/s |
| March | 31.1°C / 88.0°F | 25.3°C / 77.5°F | 10.0 mm | 2.0 | 7.9 m/s |
| April | 31.9°C / 89.4°F | 26.0°C / 78.8°F | 8.6 mm | 1.5 | 8.0 m/s |
| May | 32.0°C / 89.6°F | 26.7°C / 80.1°F | 14.1 mm | 1.7 | 8.3 m/s |
| June | 32.5°C / 90.5°F | 26.9°C / 80.4°F | 17.4 mm | 2.8 | 8.8 m/s |
| July | 32.4°C / 90.3°F | 26.7°C / 80.1°F | 31.4 mm | 4.1 | 8.2 m/s |
| August | 33.2°C / 91.8°F | 27.2°C / 81.0°F | 19.6 mm | 3.1 | 7.9 m/s |
| September | 33.2°C / 91.8°F | 27.3°C / 81.1°F | 42.9 mm | 3.3 | 6.8 m/s |
| October | 32.4°C / 90.3°F | 26.7°C / 80.1°F | 76.5 mm | 7.3 | 6.0 m/s |
| November | 31.5°C / 88.7°F | 26.0°C / 78.8°F | 87.1 mm | 9.6 | 5.6 m/s |
| December | 30.7°C / 87.3°F | 25.3°C / 77.5°F | 80.1 mm | 11.0 | 6.6 m/s |
Source: Meteorological Department of Aruba, 1991–2020 climatological normals. A rainy day means at least 1.0 mm of precipitation. Fahrenheit values are converted from the published Celsius figures. Wind readings are mean speeds, not gusts; the prevailing directions in the record are easterly, around 080–090°.
The department’s annual rainfall figure is 451.1 mm (approximately 17.8 inches). The monthly values total 451.2 mm due to rounding. April is the driest month (8.6 mm), November has the most rainfall by volume (87.1 mm), December has the most rainy days (11.0), and June is the windiest (8.8 m/s). These are historical climate averages, not a 2027 forecast.
Aruba month by month: January to December
January: Winter beach weather and early Carnival
January offers warm winter weather and early Carnival celebrations, although it is not among Aruba’s driest months. Highs average 30.3°C (86.5°F), with 44.0 mm of rainfall and 10.8 rainy days.
Easterly trade winds help moderate the afternoon heat. Resorts are busy during the northern-hemisphere winter, and Carnival festivities begin building. January 25 is Betico Croes Day, a public holiday.
Best for: Winter escapes and early Carnival events. Main drawback: Peak-season demand and occasional showers.
February: Drier weather and Carnival
February is a strong month for a dry-weather holiday and Carnival. Rainfall averages 19.5 mm across 4.5 rainy days, and highs reach 30.6°C (87.1°F).
The major Grand Carnival Parade traditionally takes place on the Sunday before Ash Wednesday. The Aruba Tourism Authority’s published schedule lists February 7, 2027, for the Grand Parade in Oranjestad. Recheck event details before traveling. Expect crowds, possible road closures and hotel demand around major celebrations.
Best for: Carnival and outdoor sightseeing. Main drawback: Busy parade weekends and accommodation prices.
March: Very low rainfall and warm beaches
March averages only 10.0 mm of rain over about two rainy days, making it excellent for beach outings and sightseeing. The average high is 31.1°C (88.0°F).
March 18 is National Anthem and Flag Day. In 2027, Easter Sunday falls on March 28, creating possible late-month travel demand. Plan Arikok hikes and exposed coastal activities early despite the comparatively comfortable season.
Best for: Low-rainfall trips and excursions. Main drawback: Spring-break and Easter demand.
April: The driest month of the year
April has the lowest average rainfall of any month, at 8.6 mm over just 1.5 rainy days. Highs average 31.9°C (89.4°F).
Although Easter Sunday is in March in 2027, school holidays may extend into early April and keep some hotel rates high. Late April is worth comparing with May. The easterly winds become more pronounced, and King’s Day is April 27.
Best for: Exceptionally dry beach weather. Main drawback: Increasing winds and school-holiday demand.
May: Very dry weather after winter peak season
May remains very dry, averaging 14.1 mm of rain over 1.7 rainy days. Daytime highs average 32.0°C (89.6°F).
This is a useful month to compare hotel offers after the main winter season, although savings are not guaranteed. Easterly trade winds average 8.3 m/s, benefiting wind sports but making exposed excursions less comfortable. Respect sea-turtle nesting areas.
Best for: Dry weather and wind sports. Main drawback: Stronger winds and hotter afternoons.
June: The windiest month
June’s mean easterly wind speed reaches 8.8 m/s (31.7 km/h), the highest monthly average of the year. Rainfall is still relatively low at 17.4 mm, with average highs of 32.5°C (90.5°F).
Hadicurari Beach is popular for windsurfing. The Atlantic hurricane season begins June 1, though Aruba lies south of many major storm tracks. St John’s Day on June 24 is connected with the traditional Dera Gai celebration.
Best for: Windsurfing and kitesurfing. Main drawback: Strong breezes and changing marine conditions.
July: Hot and breezy summer travel
July averages 32.4°C (90.3°F) for daytime highs and 31.4 mm of rain across 4.1 rainy days. Winds remain strong at 8.2 m/s.
Summer school holidays may increase family demand. The west and southwest coast generally offers more sheltered swimming than Aruba’s exposed northern and eastern shores, but marine conditions still vary by day.
Best for: Families and summer beach trips. Main drawback: Sun exposure and strong wind.
August: High temperatures and modest rainfall
August is among Aruba’s hottest months with an average high of 33.2°C (91.8°F), while rainfall remains relatively modest at 19.6 mm over 3.1 rainy days.
Mean winds ease to 7.9 m/s. Hikes should start early because of the afternoon heat. Aruba’s southerly position reduces its direct hurricane exposure, but storm-season flexibility remains useful.
Best for: Warm-water beach holidays. Main drawback: High heat and regional storm-season uncertainty.
September: Fewer crowds and lighter winds
September averages highs of 33.2°C (91.8°F), 42.9 mm of rain and lighter mean winds of 6.8 m/s. It can appeal to visitors who dislike the strong summer trades.
The Aruba Tourism Authority identifies September–November as off-season. September also falls near the Atlantic hurricane-season climatological peak, so travelers should monitor advisories and avoid inflexible connections.
Best for: Quieter resorts and less wind. Main drawback: Heat and weather uncertainty.
October: Increasing rainfall
October marks the transition toward wetter conditions, averaging 76.5 mm of rain over 7.3 rainy days. Average highs are 32.4°C (90.3°F), and mean wind speeds fall to 6.0 m/s.
Travelers with flexible plans may find low-season offers, but rainfall and offshore conditions can disrupt excursions. Regional tropical-cyclone activity can still matter even without a direct storm impact on Aruba.
Best for: Flexible low-season holidays. Main drawback: More rain and ongoing storm-season risk.
November: Wettest and least windy
November has the greatest rainfall volume, at 87.1 mm, and the lowest average wind speed, at 5.6 m/s. It averages 9.6 rainy days and a high of 31.5°C (88.7°F).
A lighter breeze may appeal to some beach travelers, but it does not guarantee calm seas. Atlantic hurricane season continues through November 30. Thanksgiving travel can temporarily increase demand.
Best for: Visitors seeking less persistent wind. Main drawback: Highest average monthly rainfall.
December: Festive holidays and returning winds
December has the highest average number of rainy days, at 11.0, and 80.1 mm of rainfall. Highs remain warm at 30.7°C (87.3°F).
Easterly winds strengthen after the autumn lull. The holiday season brings busy resorts and higher prices near Christmas and New Year. Compare early-December dates with peak holiday weeks.
Best for: Winter sunshine and festivities. Main drawback: Holiday prices and more frequent showers.
When is Aruba’s rainy season?
Aruba’s wetter months are concentrated in October through January, and November has the highest average rainfall volume. November receives 87.1 mm, approximately ten times April’s 8.6 mm, although December has slightly more measurable rainy days.
A day with at least 1.0 mm of rain does not necessarily mean continuous rainfall. The distinction between rainfall volume and rain-day frequency matters: December averages 11.0 rainy days compared with November’s 9.6. For the lowest rainfall, prioritize March through May.
When is Aruba’s windiest season?
May through July is the windiest period, with June averaging 8.8 m/s. These winds are predominantly easterly, and the seasonal decrease to 5.6 m/s in November can significantly alter the experience of outdoor activities.
Windsurfing and kitesurfing
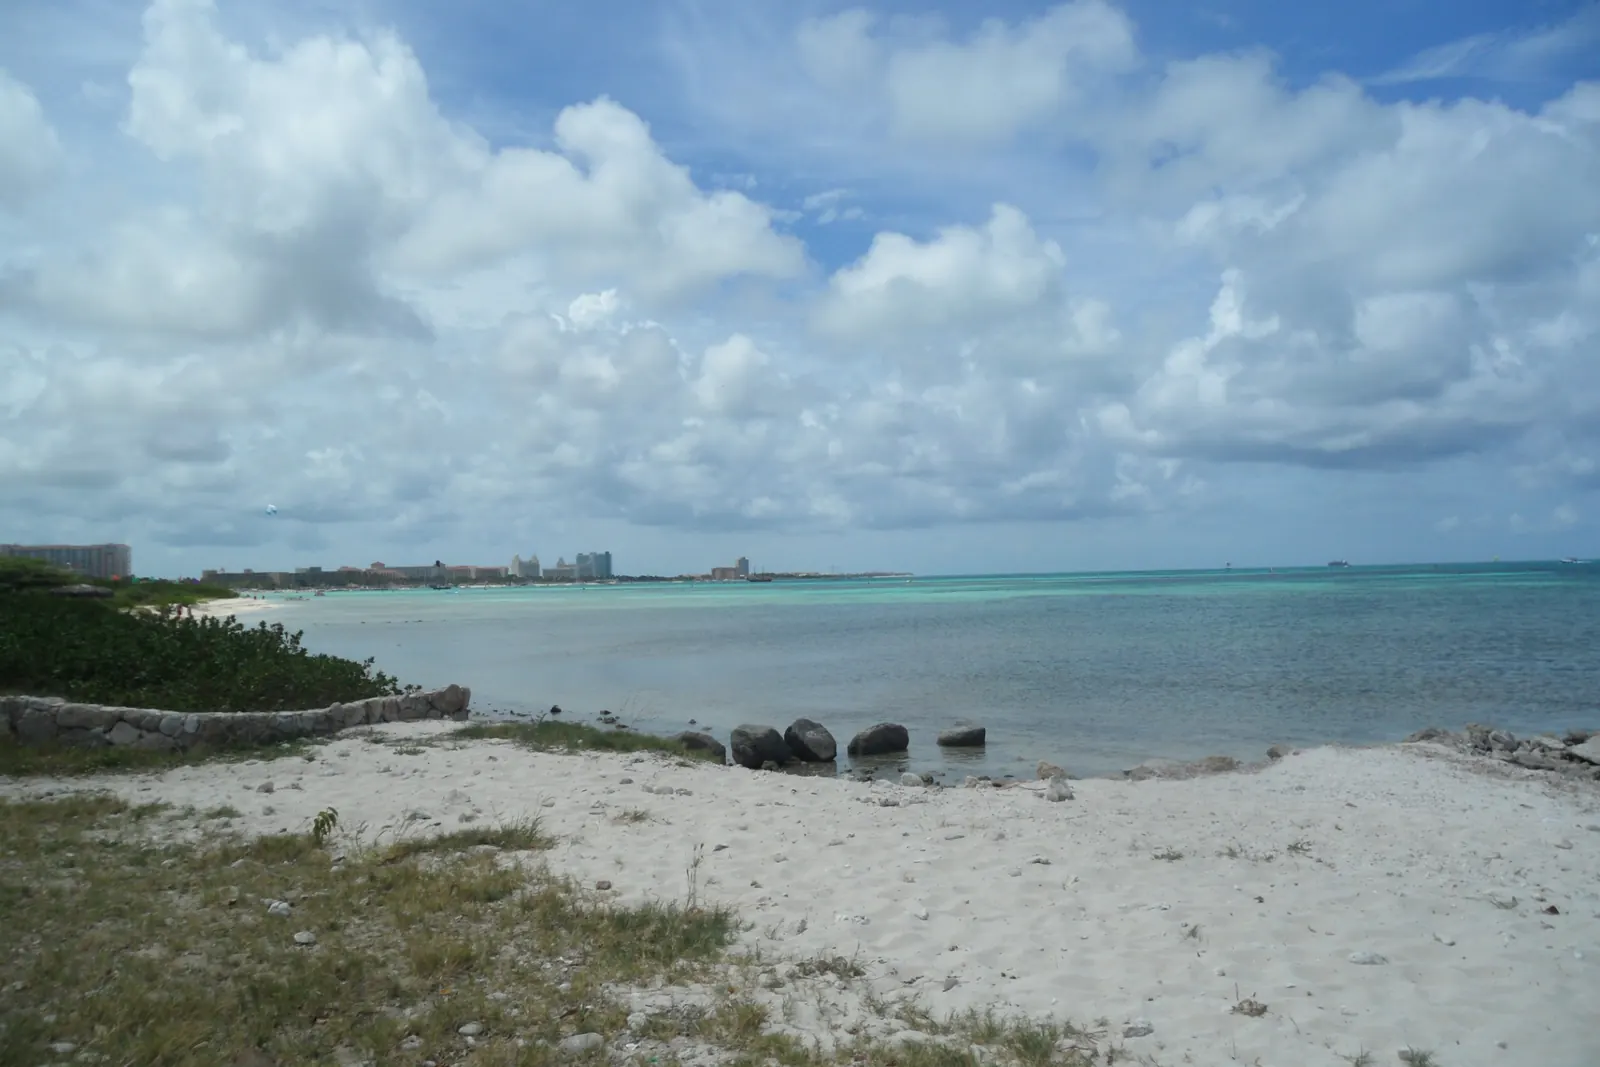
May–July is particularly attractive for wind sports. Hadicurari Beach (Fisherman’s Huts) is well known for windsurfing, while Boca Grandi appeals to experienced kitesurfers. Boca Grandi has exposed waves and currents and should not be recommended for casual swimming.
Aruba Hi-Winds is an annual wind-sports event, but its 2027 dates should not be inferred from a previous year. Verify the official organizer’s schedule before booking.
If you dislike strong winds
September–November generally brings lighter winds. The trade-off is September heat and heavier October–November rainfall. Selecting a sheltered west- or southwest-coast beach can be as important as choosing the right month.
Is Aruba safe from hurricanes?
Aruba is generally less exposed to direct hurricane impacts than northern Caribbean destinations, but it is not hurricane-proof. Its southern location puts it outside the main tracks of many Atlantic tropical cyclones.
The NOAA National Hurricane Center defines the Atlantic season as June 1–November 30, with the climatological activity peak around September 10. Regional systems can still influence rainfall, waves and flights without striking Aruba directly. Check travel-insurance exclusions, booking flexibility and official forecasts.
When is the cheapest time to visit Aruba?
September through November is Aruba’s recognized lower tourism season and is a useful period to compare accommodation rates. The Aruba Tourism Authority identifies it as the off-season, when travelers may find lower prices and fewer crowds.
Late April and May are also worth comparing after peak winter demand, particularly if low rainfall matters. However, no verified February-versus-May-versus-November price snapshot is available for this article. It would be misleading to claim that May is always cheaper or to cite invented savings percentages.
| Travel period | Demand pattern | Main trade-off |
|---|---|---|
| December–April | Peak tourism season | Some winter months are wetter than spring |
| Late April–May | After peak; compare hotel offers | Dry weather but stronger winds |
| June–August | Varies with summer holidays | Heat and strong winds |
| September–November | Recognized off-season | Heat and increasingly frequent rain |
Compare the same room category on different dates and include all taxes, fees, resort charges, transfers and cancellation terms. The cheapest advertised nightly rate is not necessarily the best overall value.
Best time to visit Aruba for beaches and snorkeling
March through May is especially attractive for dry beach days, while September through November typically has lighter winds. Beach orientation and the daily sea forecast can matter more than long-term monthly climate averages.
The Aruba Tourism Authority describes peak-season ocean temperatures of approximately 79–81°F (26–28°C). These are tourism-authority figures, not monthly water measurements from the meteorological department, whose climate-normal table leaves sea-temperature values blank.
Eagle Beach and Palm Beach
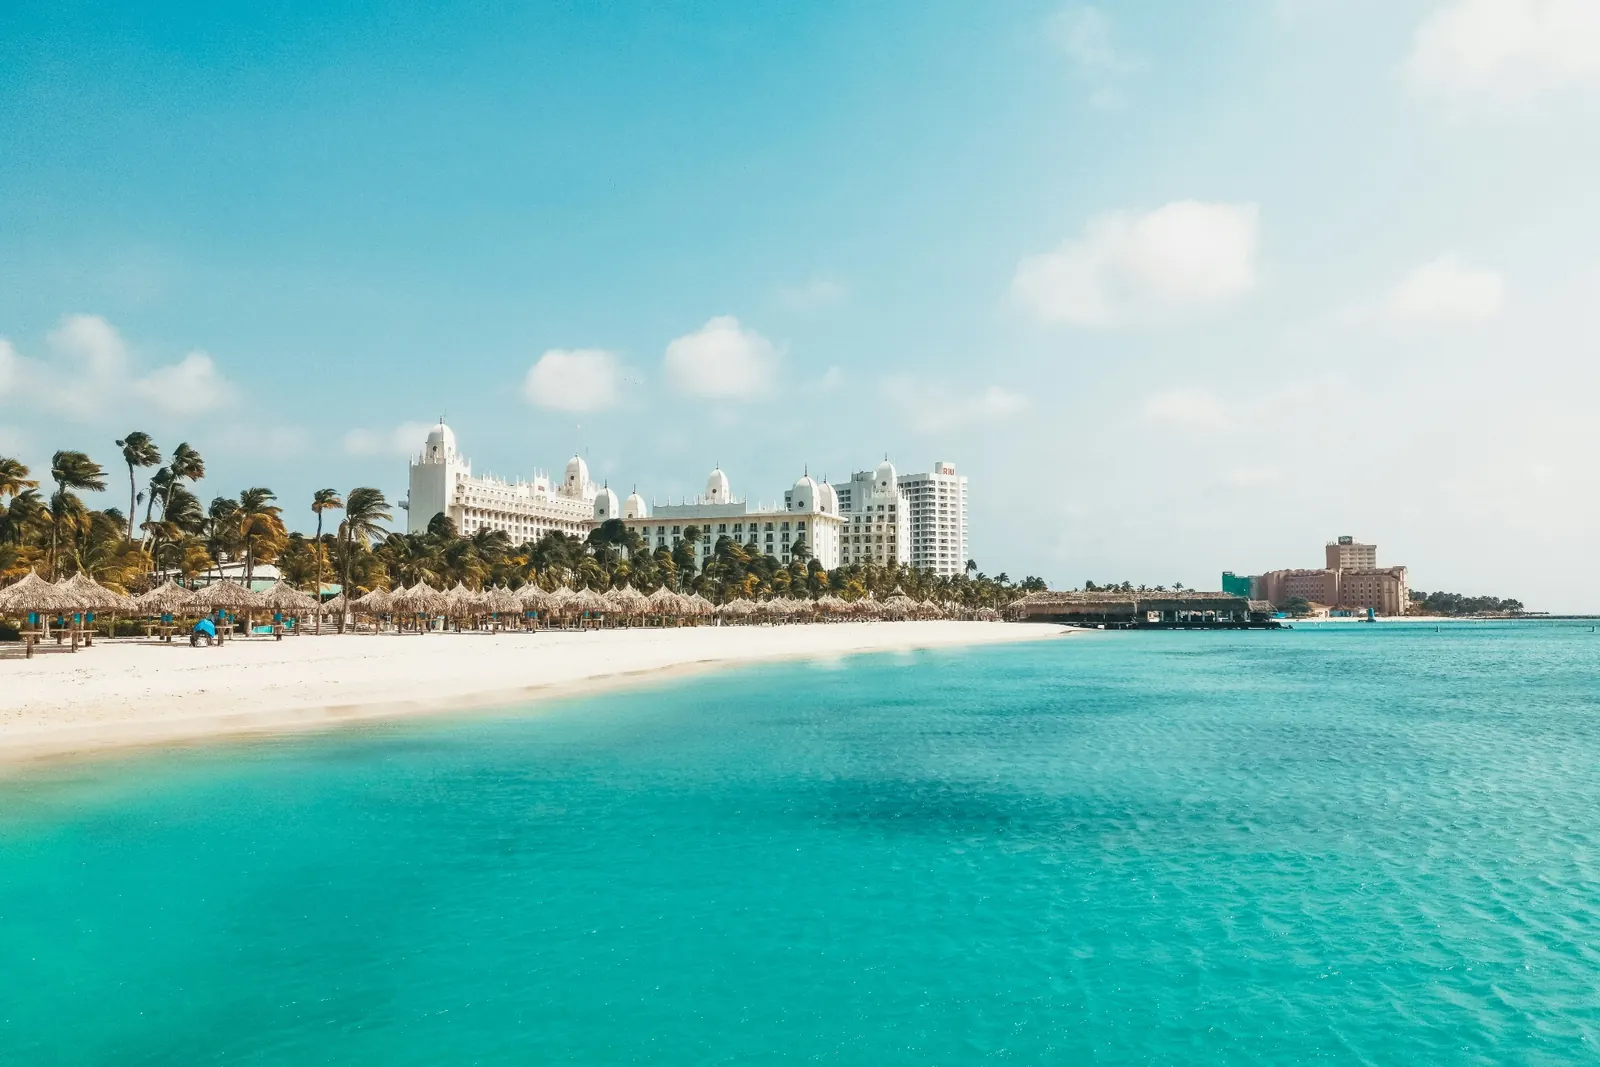
Eagle Beach has a broad sandy shoreline and marked sea-turtle nesting areas. Palm Beach offers major hotels, restaurants and organized water activities. Dry spring weather makes both appealing, but resort prices and local conditions vary.
Boca Catalina, Arashi and Mangel Halto
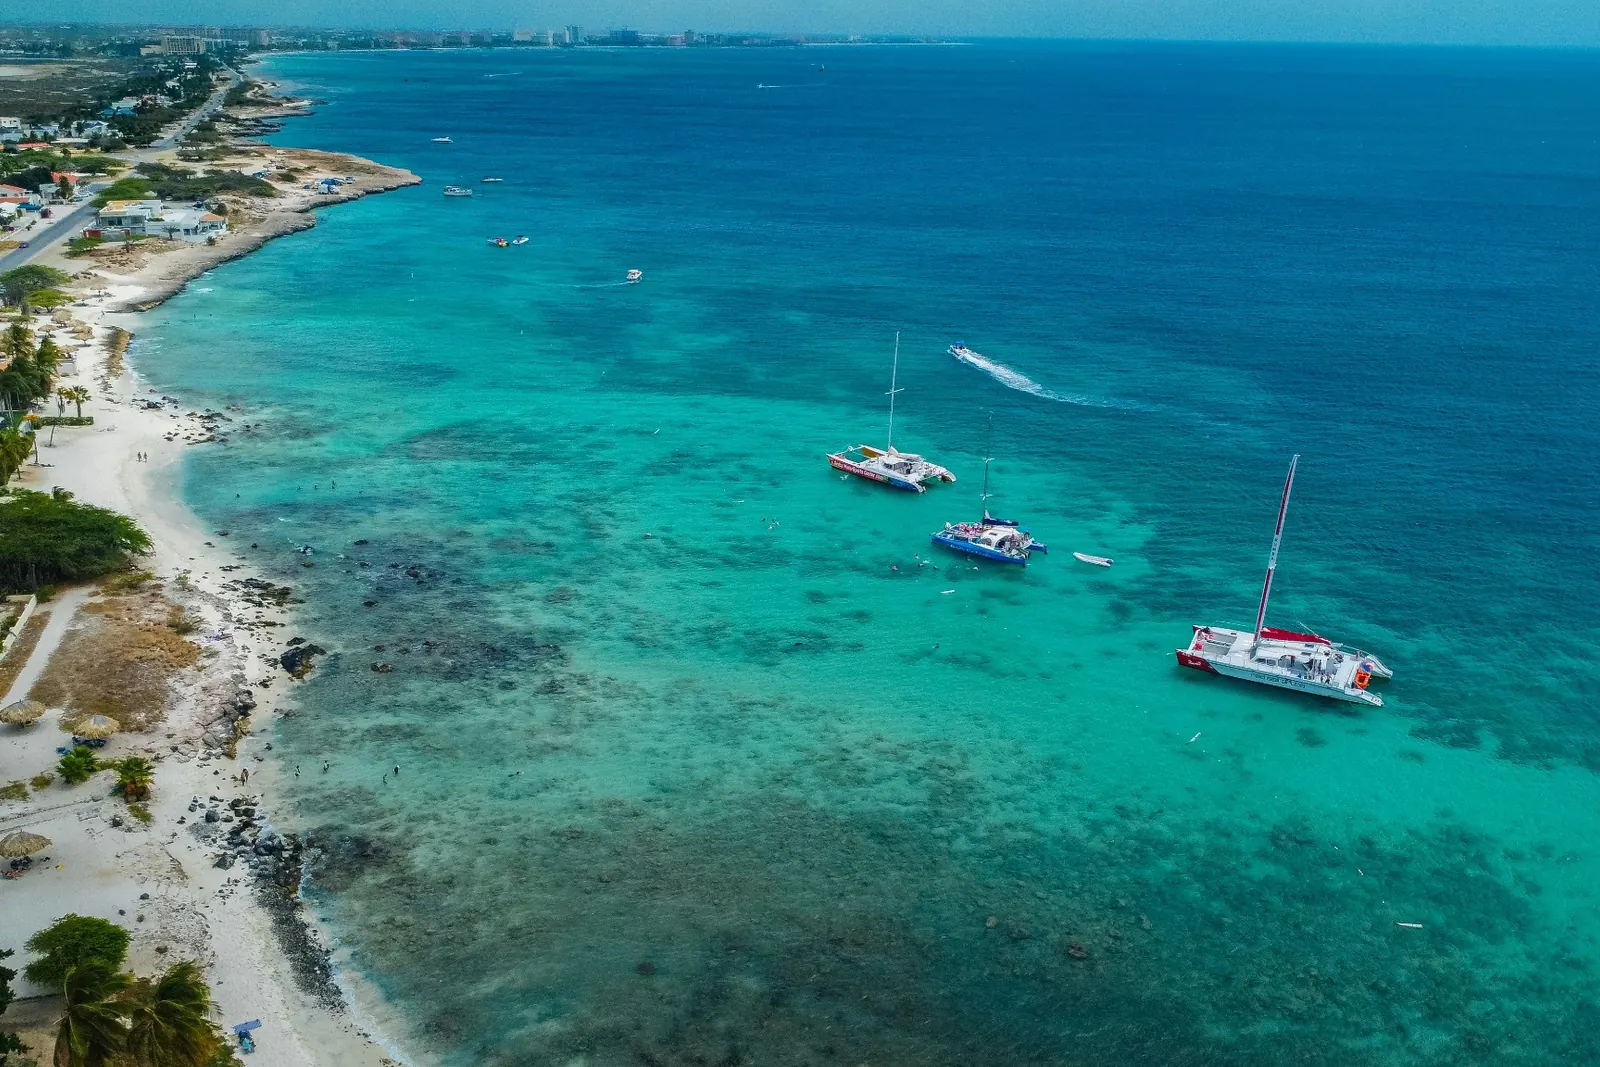
These west- and southwest-coast snorkeling locations can be attractive in suitable marine conditions. Lighter winds do not guarantee visibility or safe currents, so check local forecasts and ask an experienced operator about the specific location.
Baby Beach versus Boca Grandi
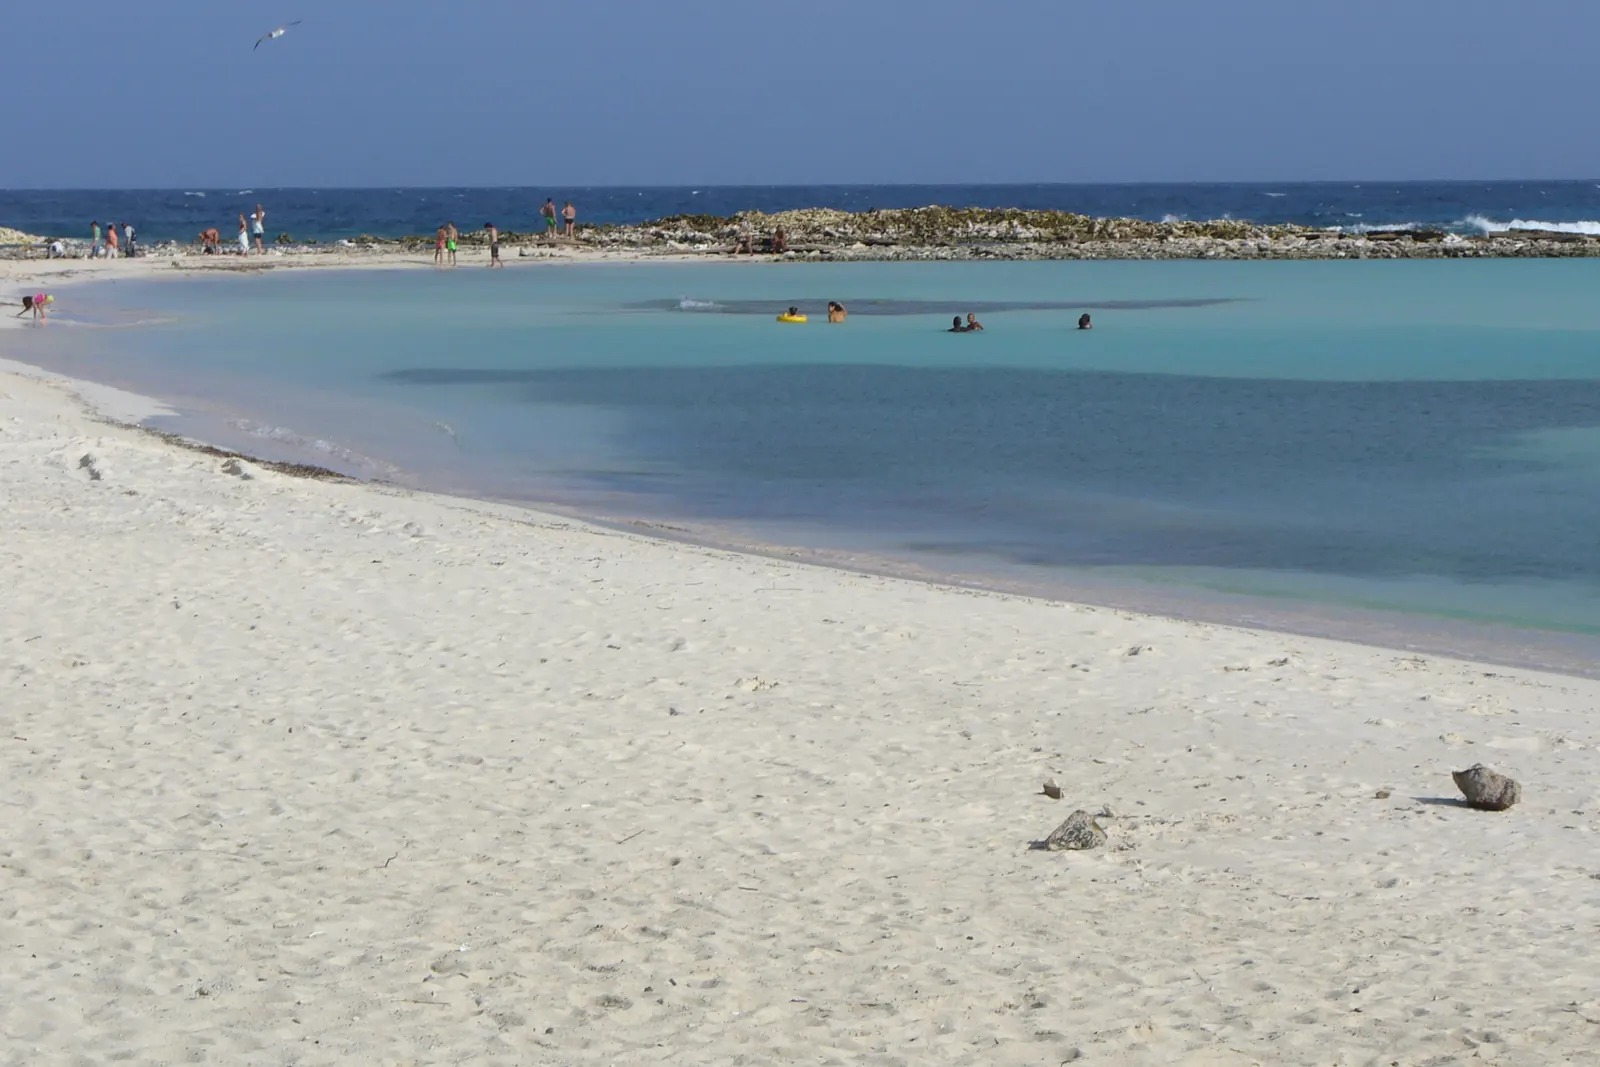
Baby Beach has a sheltered lagoon-like setting and is popular with families. Boca Grandi is exposed to strong winds, surf and currents and is better suited to experienced wind-sports participants than ordinary swimming.
Best time to visit Arikok National Park

January through March offers somewhat cooler average afternoons for exploring Arikok National Park, but highs still typically exceed 30°C. Start hikes early, carry sufficient drinking water and check park guidance.
The park protects rugged coastlines, caves and desert landscapes. Road and weather conditions can affect access to popular features such as the Natural Pool. Plan transport and access with current local information.
Aruba festivals and holidays in 2027

Carnival in January and February is the leading cultural event to plan around, with the major Oranjestad parade listed for February 7, 2027, in the Aruba Tourism Authority’s published schedule. Recheck event details before traveling.
| Event or holiday | 2027 timing | Planning note |
|---|---|---|
| New Year’s Day | January 1 | Public holiday |
| Betico Croes Day | January 25 | Public holiday |
| Grand Carnival Parade | February 7, 2027 | Listed in the Aruba Tourism Authority’s published schedule; recheck event details |
| Carnival Monday | February 8 | Public holiday |
| National Anthem and Flag Day | March 18 | Public holiday |
| Good Friday | March 26 | Public holiday |
| Easter Sunday | March 28 | Possible higher travel demand |
| Easter Monday | March 29 | Public holiday |
| King’s Day | April 27 | Public holiday |
| Labor Day | May 1 | Public holiday |
| Aruba Hi-Winds | 2027 dates unconfirmed | Annual wind-sports event |
| Dera Gai / St John’s Day | June 24 | Traditional cultural observance |
| Christmas Day | December 25 | Public holiday |
The Aruba Tourism Authority’s Grand Carnival Parade page lists February 7, 2027, for the Grand Parade in Oranjestad in its published schedule. Recheck event details before traveling.
Practical Aruba travel tips for 2027
Choose a season for its rainfall and wind profile, then choose a beach and itinerary suited to those conditions. Year-round warmth alone is not a sufficient planning guide for snorkeling, hiking or boating.
- Beach exposure: West- and southwest-coast beaches are generally more sheltered than northern and eastern shores.
- Heat: Start Arikok hikes and demanding outdoor activities early in the day.
- Carnival: Confirm dates and road access before booking.
- Wildlife: Respect marked sea-turtle nesting areas and guidance.
- Marine safety: Use local forecasts for snorkeling, swimming, boating and wind sports.
- Insurance: Aruba’s relatively low direct hurricane exposure does not eliminate weather disruptions.
Frequently asked questions
What is the best month to visit Aruba?
April has the least average rainfall, at 8.6 mm. March and May are also very dry, making March–May a strong period for warm weather with minimal ordinary rain.
What is the cheapest month to visit Aruba?
There is no universally cheapest month across all properties. September–November is Aruba’s recognized off-season and is worth checking for hotel offers.
What is Aruba’s rainiest month?
November is wettest by total rainfall, averaging 87.1 mm. December has the most rainy days, averaging 11.0.
When is Aruba’s driest month?
April, with an average of 8.6 mm of rain and 1.5 rainy days in the official 1991–2020 climate normals.
When is hurricane season in Aruba?
Atlantic hurricane season runs June 1–November 30. Aruba lies south of the principal tracks but is not completely immune to disruptive weather.
Is September a good time to visit Aruba?
September offers lighter average trade winds and potentially fewer crowds, but conditions are very hot and the Atlantic hurricane season is near its climatological peak.
Is Aruba too windy for a beach holiday?
Not necessarily. Easterly trade winds help moderate heat, and choosing a sheltered beach can help. September–November has lighter seasonal winds but more rainfall later in the period.
When is Carnival in Aruba in 2027?
The Aruba Tourism Authority’s published schedule lists Sunday, February 7, 2027, for the Grand Parade in Oranjestad. Recheck event details before traveling.
Is Aruba or the Bahamas better during hurricane season?
Aruba generally has less exposure to direct hurricane impacts because of its southern location. Both destinations still require flexible booking policies and attention to current weather forecasts.
Compare Aruba with our best time to visit the Bahamas guide, which explains a different rainfall and hurricane-season pattern.
Our best time to visit Jamaica article discusses regional climate differences. You can also read the best time to visit Turks and Caicos guide for a neighboring Caribbean option.
How we researched this guide
The temperature, rainfall, rainy-day and mean-wind data come from the Meteorological Department of Aruba’s official 1991–2020 climate normals. A rainy day is one with at least 1.0 mm of rain. Fahrenheit and km/h values are conversions from the official Celsius and m/s figures. The prevailing wind direction recorded in the report is easterly.
The department reports annual rainfall of 451.1 mm, compared with a 451.2 mm sum of its individually rounded monthly entries. The official table has unavailable sea-temperature and sunshine-duration figures, so this article does not invent monthly values for them.
Hurricane-season information uses the NOAA National Hurricane Center. Seasonality, ocean-temperature context and cultural events are attributed to the Aruba Tourism Authority. Event dates should be rechecked for 2027.
Primary sources:
- Meteorological Department of Aruba — climate normals, 1991–2020
- Aruba Tourism Authority — weather and climate
- Aruba Tourism Authority — when to visit
- NOAA — tropical cyclone climatology
- Aruba Tourism Authority — beaches
- Aruba Tourism Authority — wildlife
- Aruba Tourism Authority — Grand Carnival Parade
- Aruba Tourism Authority — Aruba Hi-Winds
Research updated October 2026. Climate normals are historical averages, not forecasts for 2027. Confirm hotel rates, holiday schedules and weather advisories for your dates.